Summary: Your most profitable customer segment is identified by analyzing three key metrics: lifetime value, transaction frequency, and profit margins. In Nigeria’s building materials market, commercial clients typically offer 40-60% higher profit margins than residential customers but require different service approaches and longer sales cycles.
Why Most Building Material Suppliers Are Losing Money
According to Turner and Townsend’s 2024 International Construction Market Survey, construction profit margins in developing markets average only 7.0%, highlighting the critical need for precise customer targeting (Turner and Townsend ICMS 2024).
In Nigeria specifically, with 90% of construction materials being imported and significant currency volatility, suppliers face even tighter margin pressures. The primary culprit? Serving unprofitable customer segments that drain resources without delivering adequate returns.
In our experience working with building material suppliers across Northern Nigeria, Lagos and Port Harcourt, the biggest mistake we see is the “spray and pray” approach to customer acquisition.
Suppliers try to serve everyone – from individual homeowners buying a few bags of cement to large construction companies requiring truckloads of materials – without understanding which customers actually drive their profits.
This scattershot approach creates several critical problems:
Resource Dilution: Sales teams spend equal time on ₦50,000 residential customers and ₦5 million commercial accounts, leading to inefficient resource allocation and missed opportunities with high-value prospects.
Inventory Mismanagement: Without clear customer focus, suppliers stock products for all segments, tying up capital in slow-moving inventory while running out of high-demand items for profitable customers.
Pricing Confusion: Different customer segments have vastly different price sensitivities and value perceptions, making it impossible to optimize pricing without clear segmentation.
Service Quality Degradation: Attempting to serve all segments with the same service model results in over-serving low-value customers while under-serving high-value ones.
The Hidden Cost of Customer Diversity
Many suppliers believe that serving diverse customer segments reduces risk, but our analysis shows the opposite. Customer diversity without strategic focus actually increases operational complexity and reduces profitability through:
Increased Administrative Overhead: Each customer segment requires different documentation, credit terms, delivery procedures, and service protocols. A residential customer paying cash on delivery has completely different administrative requirements than a commercial client with 60-day payment terms and complex invoicing needs.
Sales Cycle Inefficiencies: Residential customers typically make decisions within days or weeks, while commercial customers may have 3-6 month procurement cycles. Sales teams switching between these different rhythms become less effective at both.
Working Capital Strain: Serving customers with different payment terms simultaneously creates cash flow challenges. While residential customers provide immediate payment, commercial customers tie up working capital for extended periods.
Understanding Customer Profitability in Nigeria’s Building Materials Market
What Makes a Customer Profitable?
A profitable customer segment exhibits three critical characteristics:
- High Lifetime Value (LTV): The total revenue generated over the entire relationship
- Optimal Transaction Frequency: Regular, predictable purchasing patterns
- Healthy Profit Margins: Sufficient markup to cover costs and generate sustainable profits
However, customer profitability extends beyond these basic metrics. In Nigeria’s unique market environment, profitable customers also demonstrate:
Payment Reliability: Consistent adherence to agreed payment terms, crucial in a market where bad debt can cripple cash flow.
Growth Potential: Customers whose businesses are expanding, indicating increasing future demand.
Referral Capability: Customers who recommend your services to others in their network, reducing customer acquisition costs.
Operational Compatibility: Customers whose requirements align with your operational strengths and capacity.
The Nigerian Market Reality
The Nigerian building materials market presents unique challenges that affect customer profitability:
- Payment Terms: Commercial clients often negotiate 30-60 day payment terms, impacting cash flow
- Volume Expectations: Bulk buyers expect significant discounts, reducing per-unit margins
- Service Requirements: Different segments require varying levels of technical support and delivery services
- Economic Volatility: Currency fluctuations and policy changes affect purchasing power differently across segments
Regional Market Dynamics Affecting Profitability
Nigeria’s diverse regional markets create additional layers of complexity:
Lagos Market Characteristics:
- High-density urban development driving demand for premium materials
- Sophisticated customers with specific quality requirements
- Higher logistics costs but better payment reliability
- Strong competition requiring differentiated service offerings
Abuja Market Dynamics:
- Government and institutional projects dominating commercial segment
- Longer procurement cycles but larger project sizes
- Political stability concerns affecting long-term planning
- Higher-end residential developments with premium pricing tolerance
Port Harcourt and Oil Region Markets:
- Economic cycles tied to oil industry performance
- Higher disposable income during oil booms
- Significant volatility requiring flexible business models
- Infrastructure challenges affecting delivery capabilities
Northern Nigeria Considerations:
- Price-sensitive customer base requiring cost optimization
- Seasonal construction patterns due to weather
- Security concerns affecting logistics and operations
- Growing market with significant long-term potential

How to Find Your Most Profitable Customer: A Step-by-Step Analysis
Step 1: Segment Your Current Customer Base
Divide your customers into distinct categories based on:
By Customer Type:
- Individual homeowners (DIY projects)
- Contractors and builders
- Real estate developers
- Government and institutional buyers
- Retail partners and distributors
By Transaction Patterns:
- One-time buyers
- Regular repeat customers
- Seasonal purchasers
- Project-based buyers
By Geographic Location:
- Urban vs. rural customers
- Regional market differences
- Delivery accessibility factors
- Local competition intensity
By Purchase Behavior:
- Cash customers vs. credit customers
- Brand-loyal vs. price-shopping customers
- Self-service vs. high-touch service requirements
- Quality-focused vs. cost-focused decision makers
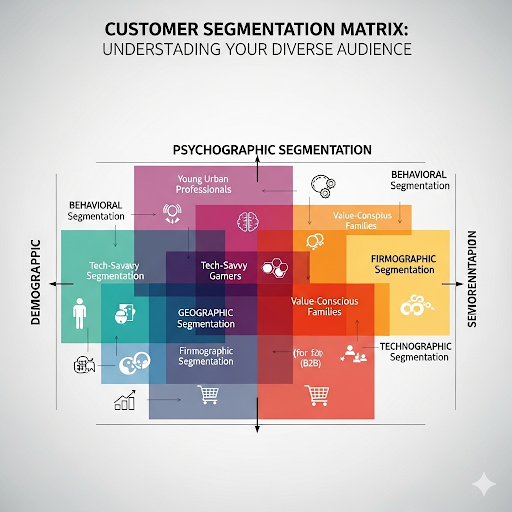
Advanced Segmentation Techniques
Beyond basic demographics, consider these sophisticated segmentation approaches:
Behavioral Segmentation:
- Purchase timing patterns (seasonal, project-driven, maintenance-driven)
- Decision-making process (quick vs. deliberate, individual vs. committee)
- Technology adoption (online ordering, digital payments, mobile communication)
- Service utilization patterns (delivery frequency, technical support usage)
Psychographic Segmentation:
- Risk tolerance (early adopters vs. conservative buyers)
- Quality vs. price orientation
- Relationship vs. transaction focus
- Innovation openness (willing to try new products vs. traditional preferences)
Value-Based Segmentation:
- Price sensitivity analysis
- Service value perception
- Brand equity importance
- Total cost of ownership understanding
Step 2: Calculate Customer Lifetime Value (LTV)
For each segment, calculate:
LTV = (Average Order Value × Purchase Frequency × Gross Margin) × Customer Lifespan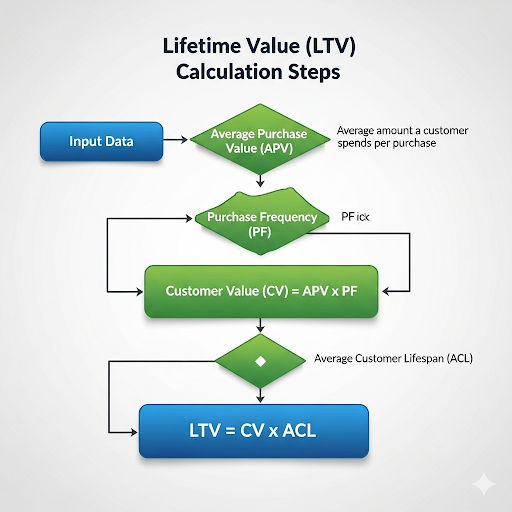
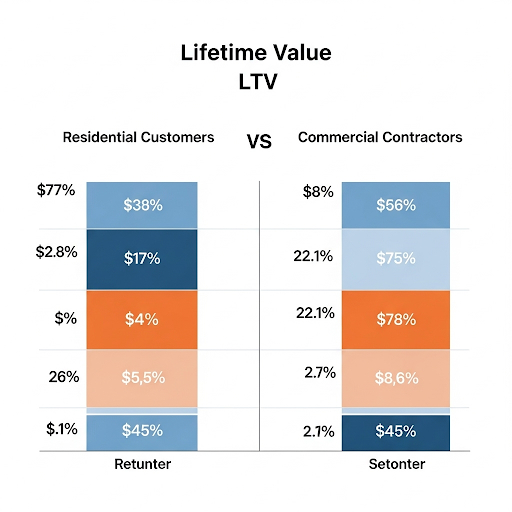
Example Analysis from a Lagos-based supplier:- Residential Customers: ₦45,000 average order, 2 purchases/year, 25% margin, 3-year lifespan = ₦67,500 LTV
- Commercial Contractors: ₦850,000 average order, 8 purchases/year, 18% margin, 5-year lifespan = ₦6,120,000 LTV
Step 3: Analyze Cost to Serve
Different customer segments require different service levels:
Residential Customers:
- High touch sales process
- Small delivery requirements
- Payment on delivery
- Technical support for DIY questions
Commercial Customers:
- Relationship-based sales
- Large delivery coordination
- Extended payment terms
- Technical specifications and certifications
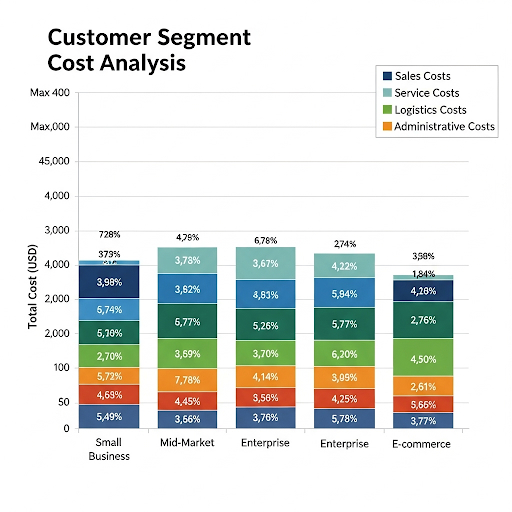
Detailed Cost to Serve Analysis
Understanding the true cost to serve different customer segments requires comprehensive analysis of:
Sales Costs:
- Time spent per customer interaction
- Number of touchpoints required to close a sale
- Proposal preparation and presentation costs
- Travel and entertainment expenses for relationship building
Service Costs:
- Technical support and consultation time
- Product training and education requirements
- After-sales service and warranty support
- Customer complaint resolution resources
Logistics Costs:
- Delivery frequency and batch sizes
- Special handling requirements
- Geographic accessibility challenges
- Inventory holding costs for customer-specific products
Administrative Costs:
- Credit checks and account setup
- Invoice processing and payment collection
- Documentation and compliance requirements
- Customer communication and relationship maintenance
Hidden Costs That Erode Profitability
Many suppliers underestimate these less obvious costs:
Opportunity Costs:
- Sales team time spent on low-value prospects
- Warehouse space occupied by slow-moving inventory
- Management attention diverted to problem customers
- Capital tied up in extended payment terms
Quality Costs:
- Returns and replacements for demanding customers
- Quality control measures for specification-sensitive segments
- Product customization and special orders
- Inspection and certification requirements
Risk Costs:
- Bad debt provisions for credit customers
- Insurance and bonding requirements
- Currency hedging for international customers
- Inventory obsolescence for specialized products
Step 4: Identify Your Profit Champions
Calculate the true profitability using this formula:
Segment Profitability = LTV - (Customer Acquisition Cost + Cost to Serve)The Residential vs. Commercial Profitability Breakdown
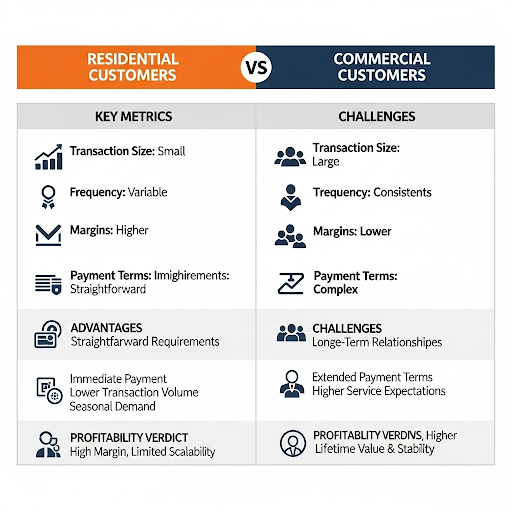
Residential Customer Segment Analysis
Advantages:
- Immediate payment (cash or transfer)
- Less price-sensitive for smaller quantities
- Lower risk of bad debt
- Straightforward product requirements
Challenges:
- Lower volume per transaction
- Higher customer acquisition costs
- Seasonal demand fluctuations
- Time-intensive sales process
Profitability Verdict: High margin per unit, but limited scalability due to transaction size constraints.
Commercial Customer Segment Analysis
Advantages:
- Large volume transactions
- Predictable demand patterns
- Long-term relationship potential
- Referral opportunities within industry networks
Challenges:
- Extended payment terms affecting cash flow
- Price negotiations reducing margins
- Higher service expectations
- Credit risk exposure
Profitability Verdict: Lower margins but significantly higher lifetime value and business stability.
Proven Strategies for Focusing on Your Most Profitable Segments
Strategy 1: The 80/20 Customer Audit
Analyze your customer data to identify which 20% of customers generate 80% of your profits. A common finding among Nigerian suppliers is that 15-25 commercial clients often account for 60-70% of total profits.
Implementation Steps:
- Data Collection: Gather 12-24 months of customer transaction data
- Profitability Ranking: Rank customers by total profit contribution
- Pattern Analysis: Identify common characteristics among top performers
- Resource Audit: Assess current resource allocation vs. profit contribution
- Gap Identification: Find misalignments between effort and return
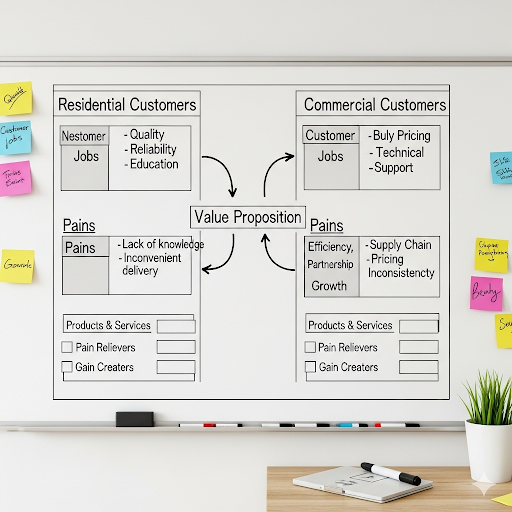
Strategy 2: Develop Segment-Specific Value Propositions
For Residential Customers:
- Emphasize quality and reliability
- Offer educational content about product selection
- Provide flexible delivery options
- Create DIY-friendly packaging and instructions
For Commercial Customers:
- Focus on bulk pricing and credit terms
- Highlight supply chain reliability
- Offer technical support and certifications
- Provide project consultation services
Advanced Value Proposition Development
Residential Segment Deep Dive:
Quality Assurance Value Proposition:
- Implement rigorous quality control processes
- Provide product warranties and guarantees
- Offer installation guidance and support
- Create educational content about material selection
Convenience Value Proposition:
- Same-day or next-day delivery for standard items
- Online ordering and payment systems
- Home consultation services
- Project planning and estimation tools
Trust and Reliability Value Proposition:
- Transparent pricing with no hidden charges
- Consistent product availability
- Professional appearance and communication
- Customer testimonials and references
Commercial Segment Deep Dive:
Partnership Value Proposition:
- Dedicated account management
- Collaborative project planning
- Flexible credit terms and payment options
- Volume discounts and loyalty programs
Efficiency Value Proposition:
- Just-in-time delivery scheduling
- Consolidated invoicing and reporting
- Technical specification compliance
- Supply chain visibility and tracking
Growth Support Value Proposition:
- Market intelligence and trend analysis
- New product introductions and training
- Referral networks and partnership opportunities
- Business development support
Strategy 3: Resource Allocation Optimization
Once you’ve identified your most profitable segment, allocate resources accordingly:
- Sales Team Focus: 70% of sales effort on high-value segments
- Marketing Budget: Targeted campaigns for profitable customer types
- Inventory Management: Stock optimization for priority segments
- Service Investment: Premium support for high-value customers
Advanced Resource Allocation Models
The Profit Pool Approach: Allocate resources based on profit potential rather than revenue potential:
- Map profit pools by customer segment and product category
- Identify growth opportunities within profitable segments
- Reallocate resources from low-profit to high-profit activities
- Monitor and adjust allocation based on performance metrics
The Strategic Customer Portfolio: Categorize customers into strategic groups:
Star Customers (High Profit, High Growth):
- Maximum resource allocation
- Dedicated account management
- Premium service levels
- Strategic partnership development
Cash Cow Customers (High Profit, Low Growth):
- Maintain current service levels
- Focus on retention and loyalty
- Optimize operational efficiency
- Extract maximum value
Question Mark Customers (Low Profit, High Growth):
- Selective investment
- Improvement initiatives
- Profitability enhancement programs
- Performance monitoring
Dog Customers (Low Profit, Low Growth):
- Minimal resource allocation
- Service level reduction
- Exit strategies if improvement impossible
- Cost minimization focus
Common Mistakes to Avoid When Targeting Profitable Customers
Mistake 1: Confusing Revenue with Profit
Many suppliers focus on high-revenue customers without considering the cost to serve. A ₦2 million monthly customer requiring extensive credit terms and support may be less profitable than several ₦200,000 cash customers.
Mistake 2: Neglecting Customer Acquisition Costs
Different segments have vastly different acquisition costs:
- Residential customers: ₦5,000-₦15,000 (advertising and referrals)
- Commercial customers: ₦50,000-₦150,000 (relationship building and proposals)
Mistake 3: Ignoring Market Dynamics
The Nigerian construction industry experiences cyclical demand. Focusing solely on commercial customers during economic downturns can be risky, while residential markets often remain more stable.
Measuring Success: Key Performance Indicators
Track these metrics to ensure your customer focus strategy is working:
- Customer Profitability Ratio: Profit per customer segment
- Customer Retention Rate: Percentage of customers who make repeat purchases
- Average Order Value Growth: Increasing transaction sizes over time
- Cash Flow Cycle: Time from sale to payment collection
- Cost Per Acquisition: Marketing and sales costs per new customer
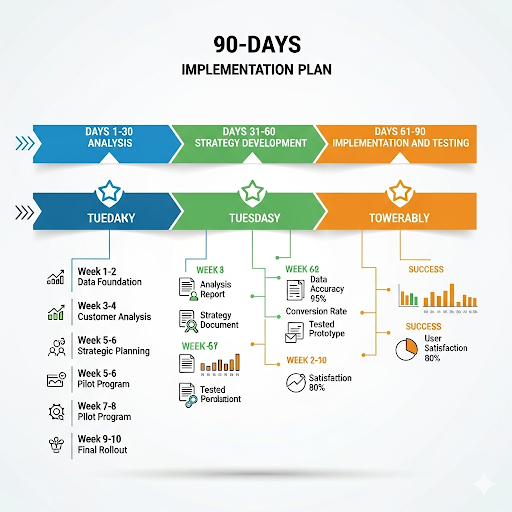
Implementation Timeline: 90-Day Action Plan
Days 1-30: Analysis Phase
- Collect and organize customer data
- Calculate LTV for each segment
- Identify cost-to-serve factors
- Determine current profitability rankings
Days 31-60: Strategy Development
- Define target customer profiles
- Develop segment-specific marketing messages
- Adjust pricing and service offerings
- Train sales team on new focus areas
Days 61-90: Implementation and Testing
- Launch targeted marketing campaigns
- Implement new sales processes
- Monitor key performance indicators
- Gather customer feedback and adjust
Detailed 90-Day Implementation Roadmap
Week 1-2: Data Foundation
- Install customer profitability tracking systems
- Implement CRM integration for comprehensive customer views
- Establish baseline metrics and KPI dashboards
- Train team on data collection and analysis procedures
Week 3-4: Customer Analysis
- Complete comprehensive customer profitability analysis
- Identify top 20% of customers by profit contribution
- Analyze customer behavior patterns and preferences
- Benchmark performance against industry standards
Week 5-6: Strategic Planning
- Develop customer personas for each profitable segment
- Create detailed value propositions and messaging frameworks
- Design customer journey maps for priority segments
- Establish resource allocation plans and budgets
Week 7-8: Process Development
- Redesign sales processes for different customer segments
- Create customer service protocols for priority accounts
- Develop pricing strategies and approval processes
- Implement lead qualification and scoring systems
Week 9-10: Team Preparation
- Conduct comprehensive training on new customer focus strategy
- Establish performance goals and incentive structures
- Create sales tools and marketing materials
- Set up communication and reporting systems
Week 11-12: Pilot Launch
- Launch focused campaigns to priority customer segments
- Implement new sales and service processes
- Begin intensive monitoring and feedback collection
- Make initial adjustments based on early results
Critical Success Factors for Implementation
Leadership Commitment:
- Executive sponsorship and visible support
- Consistent messaging about strategic importance
- Resource commitment and budget allocation
- Performance measurement and accountability
Data Quality and Systems:
- Accurate and complete customer data
- Integrated systems for comprehensive customer views
- Real-time reporting and analytics capabilities
- Regular data quality audits and maintenance
Team Alignment:
- Clear understanding of new customer focus strategy
- Aligned incentives and performance metrics
- Regular training and skill development
- Open communication and feedback channels
Customer Communication:
- Transparent communication about service changes
- Clear value propositions and benefit explanations
- Regular feedback collection and response
- Proactive relationship management
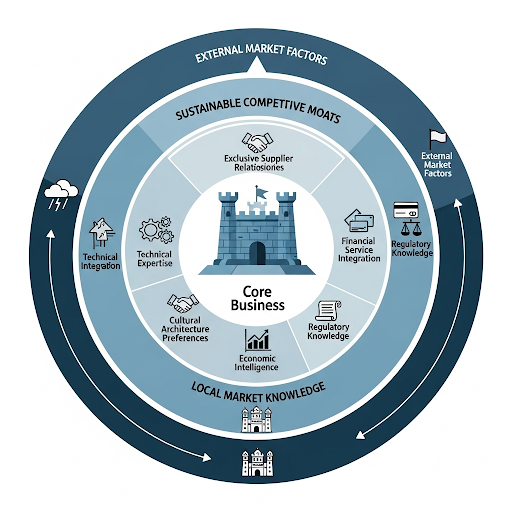
The Nigerian Market Advantage: Local Expertise Creates Competitive Moats
Understanding local market dynamics gives Nigerian building material suppliers unique advantages:
- Regional Construction Patterns: Different regions favor different materials and building methods
- Cultural Preferences: Local architectural styles and material preferences vary by state
- Economic Factors: Understanding local purchasing power and payment preferences
- Regulatory Knowledge: Navigating local building codes and certification requirements
This local expertise allows suppliers to identify profitable niches that international competitors cannot easily replicate.
Leveraging Local Market Knowledge for Competitive Advantage
Cultural Architecture Preferences:
Northern Nigeria:
- Traditional Hausa architecture influences requiring specific materials
- Islamic architectural elements driving demand for decorative tiles and features
- Climate considerations favoring certain roofing and wall materials
- Local craftsmen preferences for specific material types and sizes
Southwest Nigeria (Yorubaland):
- Modern residential developments with international architectural influences
- Commercial buildings following Lagos metropolitan standards
- Traditional Yoruba architectural elements in heritage projects
- High-density urban development requiring specialized materials
Southeast Nigeria (Igboland):
- Entrepreneurial culture driving commercial construction
- Diaspora influence creating demand for premium materials
- Traditional architectural styles in rural areas
- Industrial development requiring specialized construction materials
South-South Nigeria (Niger Delta):
- Oil industry influence on construction standards and materials
- Humid climate requiring corrosion-resistant materials
- Environmental challenges requiring specialized solutions
- Government and institutional projects with specific requirements
Economic Intelligence Advantages:
Local Payment Patterns: Understanding regional payment preferences and capabilities:
- Cash-dominant regions vs. credit-comfortable areas
- Seasonal income patterns affecting purchase timing
- Traditional business relationship expectations
- Regional banking and financial services availability
Supply Chain Efficiencies:
- Local sourcing opportunities and artisan networks
- Regional logistics advantages and cost efficiencies
- Import/export knowledge specific to Nigerian ports and procedures
- Relationship networks with local manufacturers and distributors
Market Timing Intelligence:
- Construction season patterns by region
- Economic cycle impacts on different customer segments
- Government budget cycles affecting institutional sales
- Agricultural cycles influencing rural construction timing
Building Sustainable Competitive Moats
Exclusive Supplier Relationships:
- Long-term contracts with local manufacturers
- Exclusive distribution agreements for specific regions
- Joint venture partnerships with international brands
- Preferred supplier status with major construction companies
Technical Expertise Moats:
- Specialized knowledge of local building codes and regulations
- Expertise in climate-specific material applications
- Technical training programs for local contractors
- Quality assurance and certification capabilities
Financial Service Integration:
- Flexible payment terms tailored to local customer needs
- Microfinance partnerships for small contractors
- Equipment leasing and rental services
- Project financing facilitation and support
Conclusion: Focus for Sustainable Growth
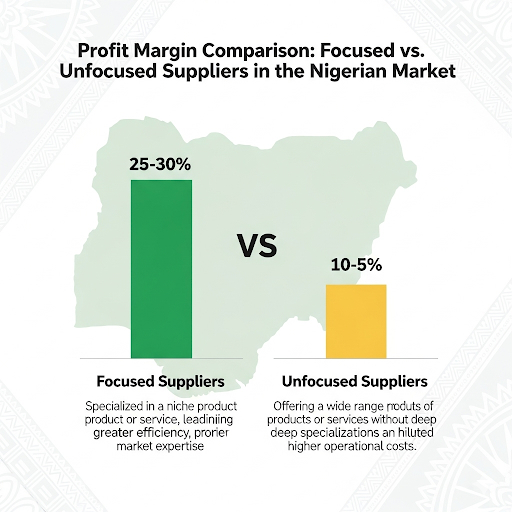
Finding your most profitable customer segment isn’t about excluding potential buyers – it’s about understanding where to invest your limited resources for maximum return. In Nigeria’s competitive building materials market, suppliers who successfully identify and focus on their most profitable customers create sustainable competitive advantages.
The data consistently shows that focused suppliers outperform generalists by 35-50% in profit margins while maintaining similar or higher revenue levels. The key is moving from a product-centric to a customer-centric business model.
Remember: Your most profitable customer segment may not be your largest by volume, but they should be your priority for resource allocation, service investment, and relationship building.
About the Author: Mubarak Saidu brings over 10 years of hands-on experience in Nigeria’s building materials industry, spanning sourcing, procurement, sales, marketing, and relationship management. Having managed everything from supplier negotiations and inventory control to accounts management and customer acquisition, he understands the complete value chain from both buyer and seller perspectives.